Stunning and innovative reporting and insights

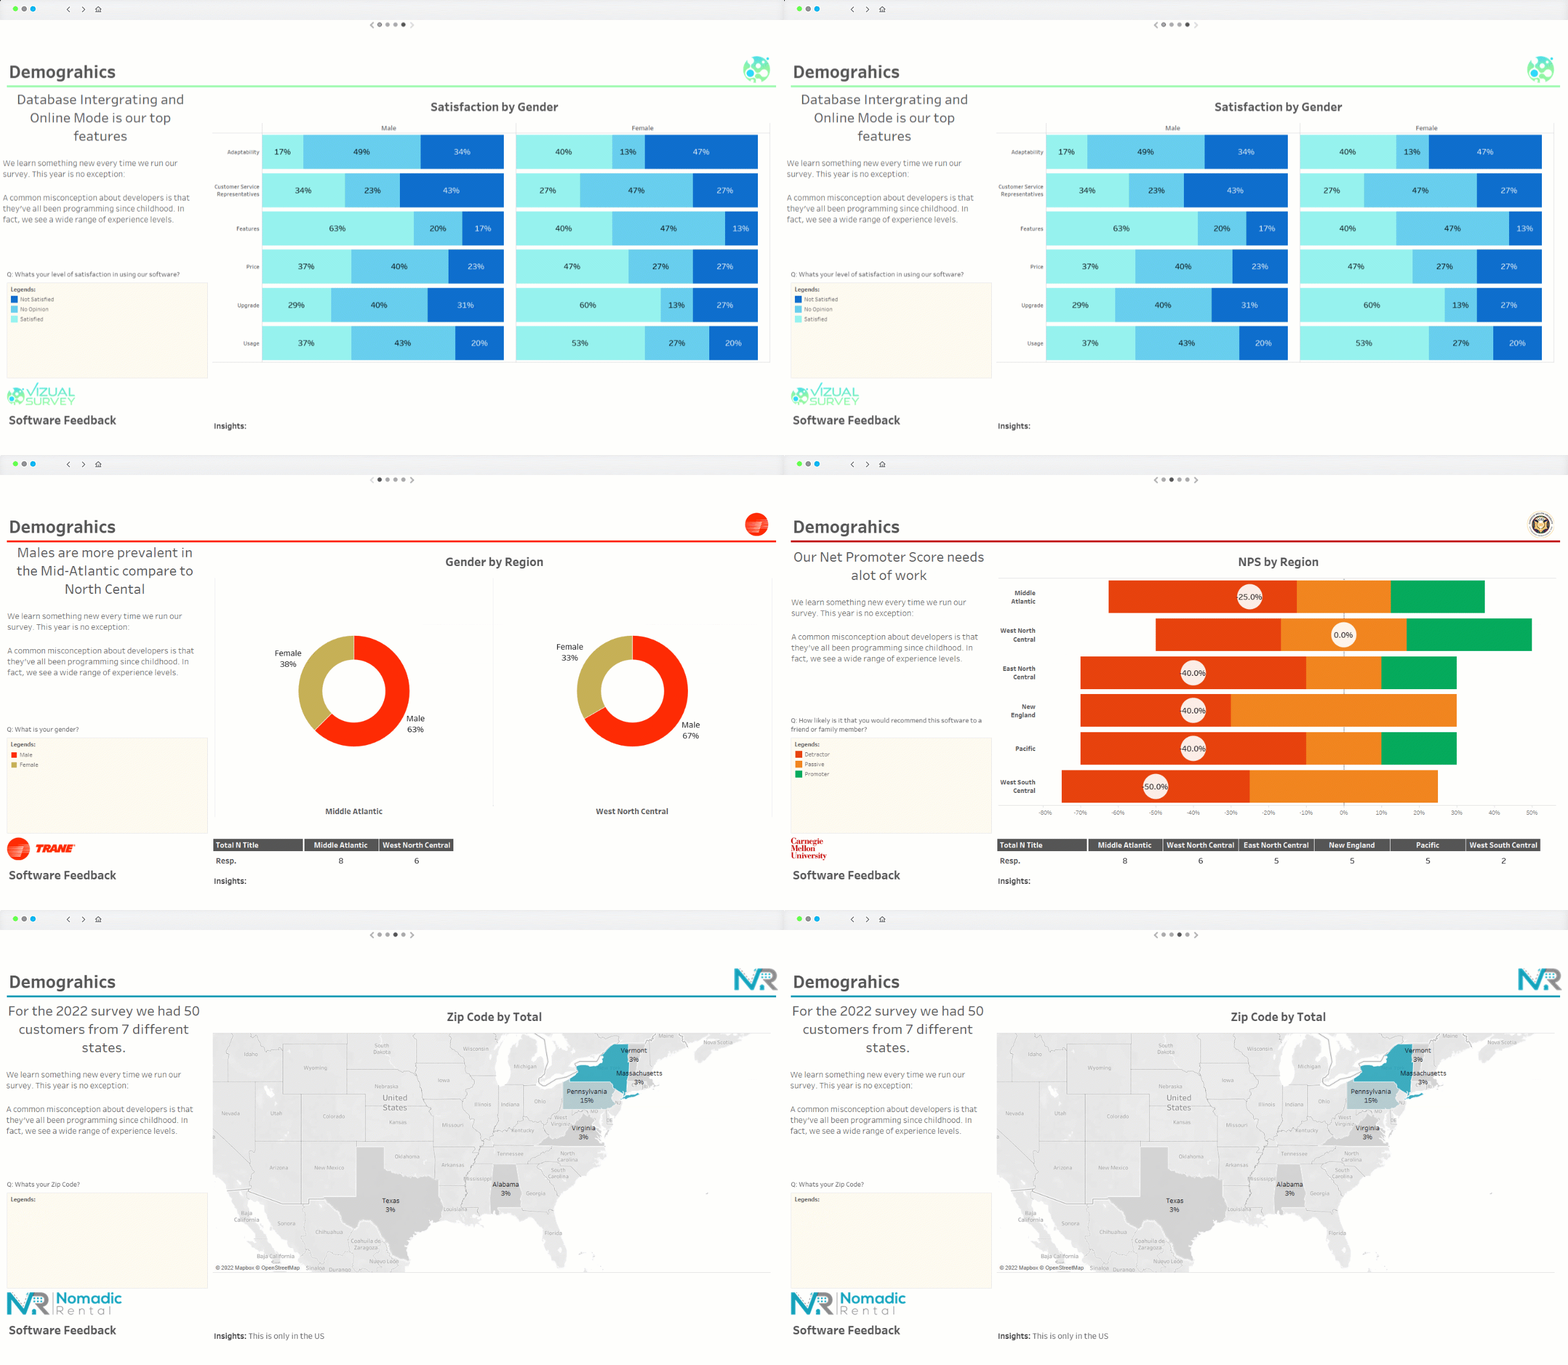
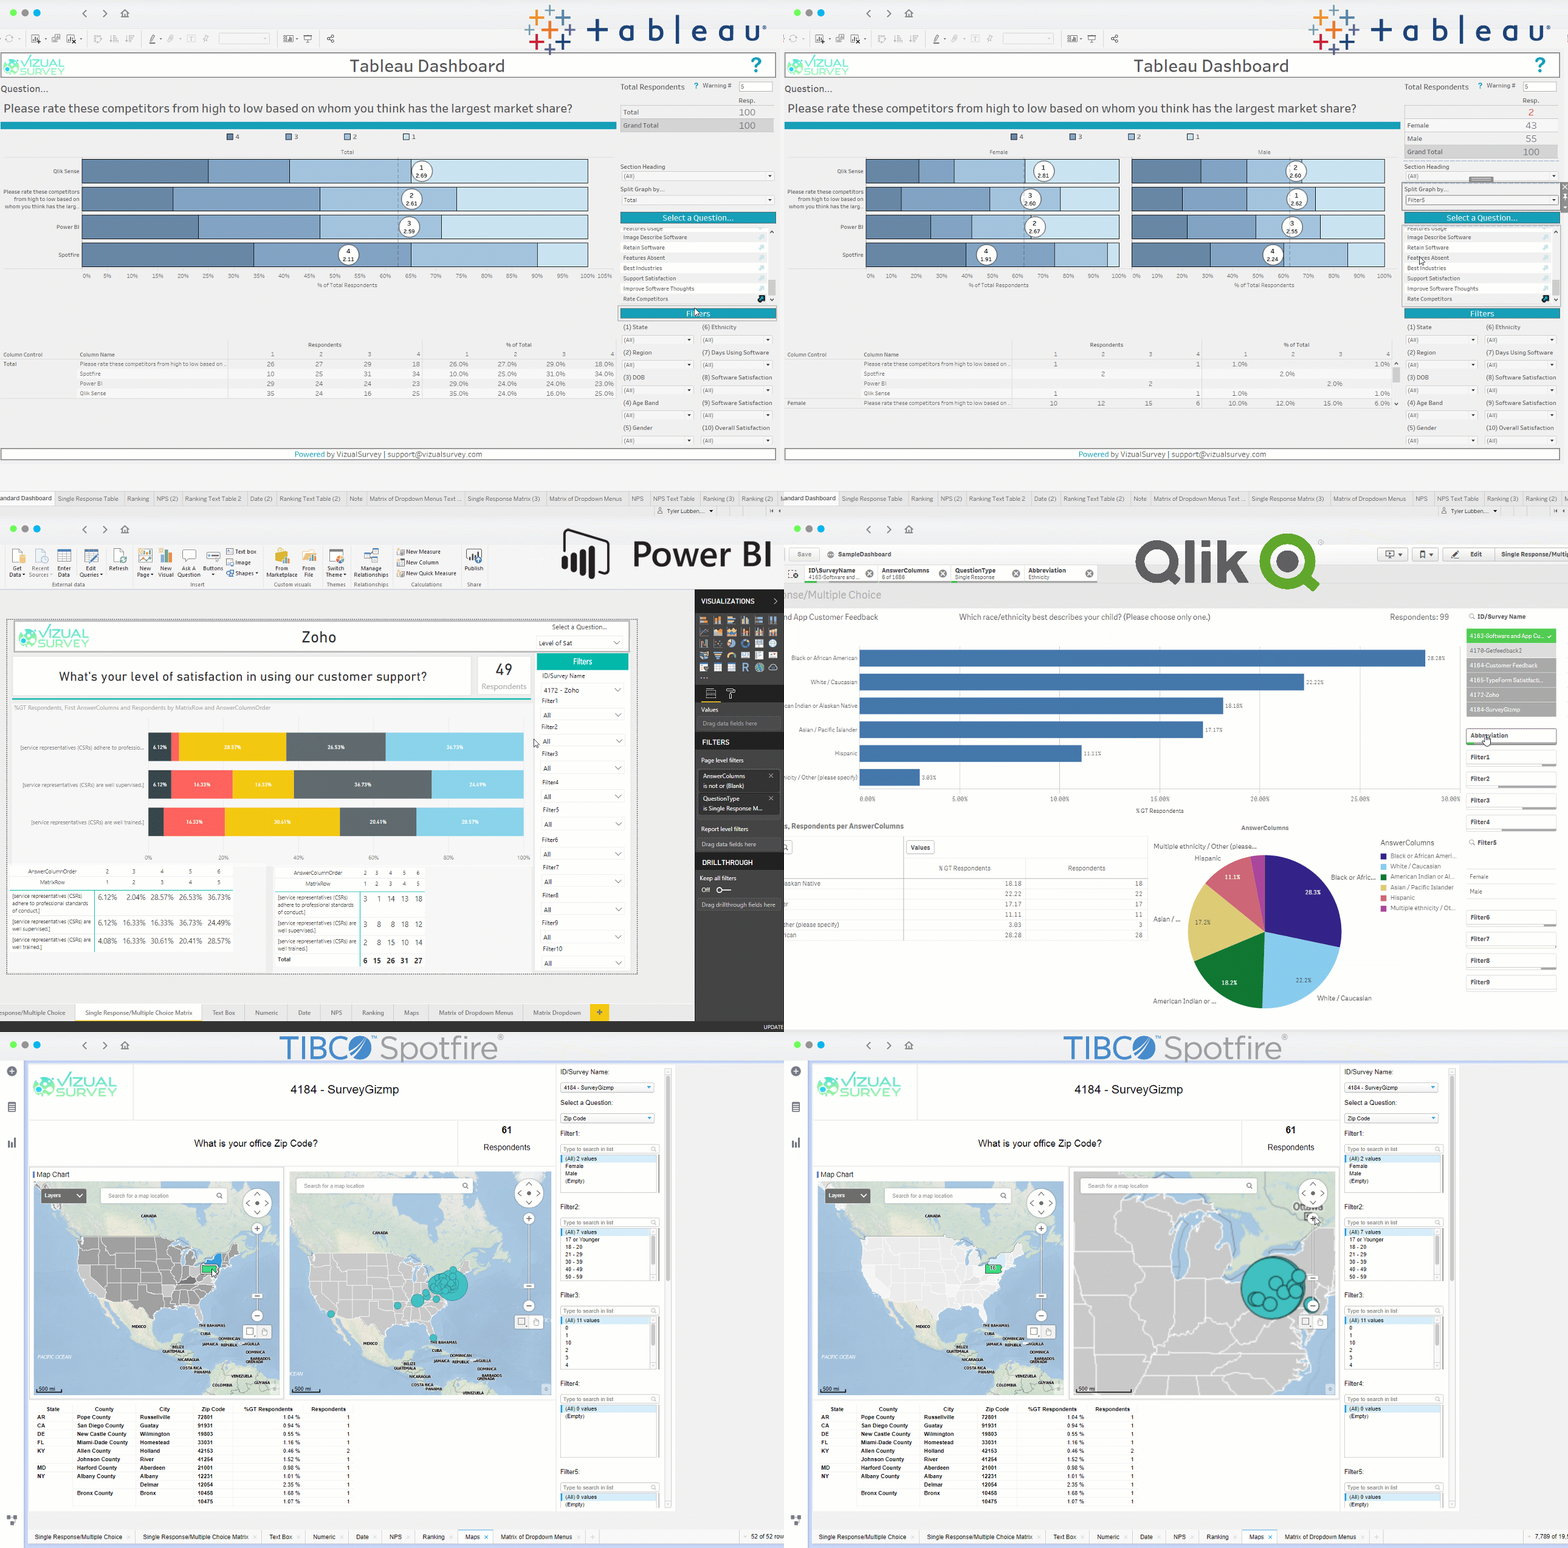
Stunning prebuilt interactive survey dashboards and reports built by Tableau experts
- No need to create a Tableau dashboard from scratch, use our template dashboards and start visualizing instantly
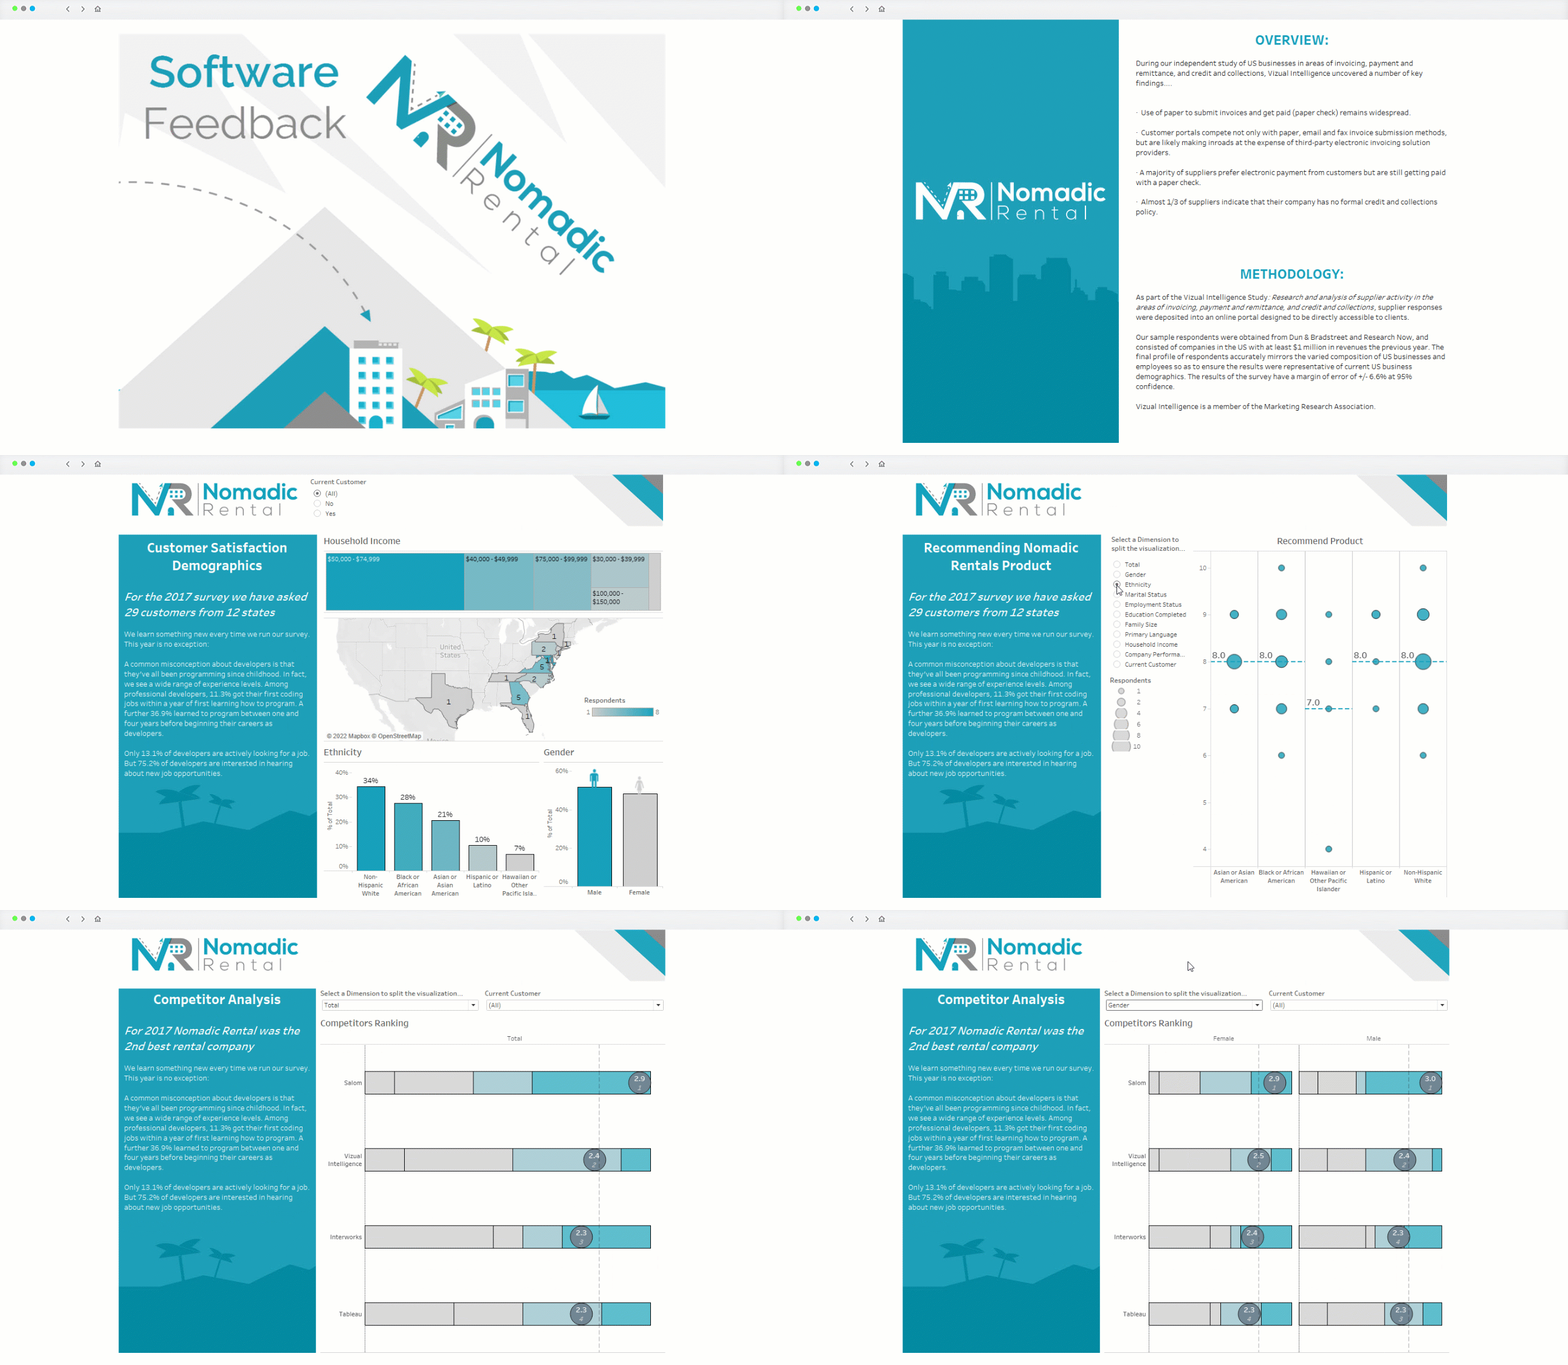
- Create interactive reports and presentations easily with our Tableau report builder
- Find amazing insight by filtering, segmenting and visualizing your data in different chart styles
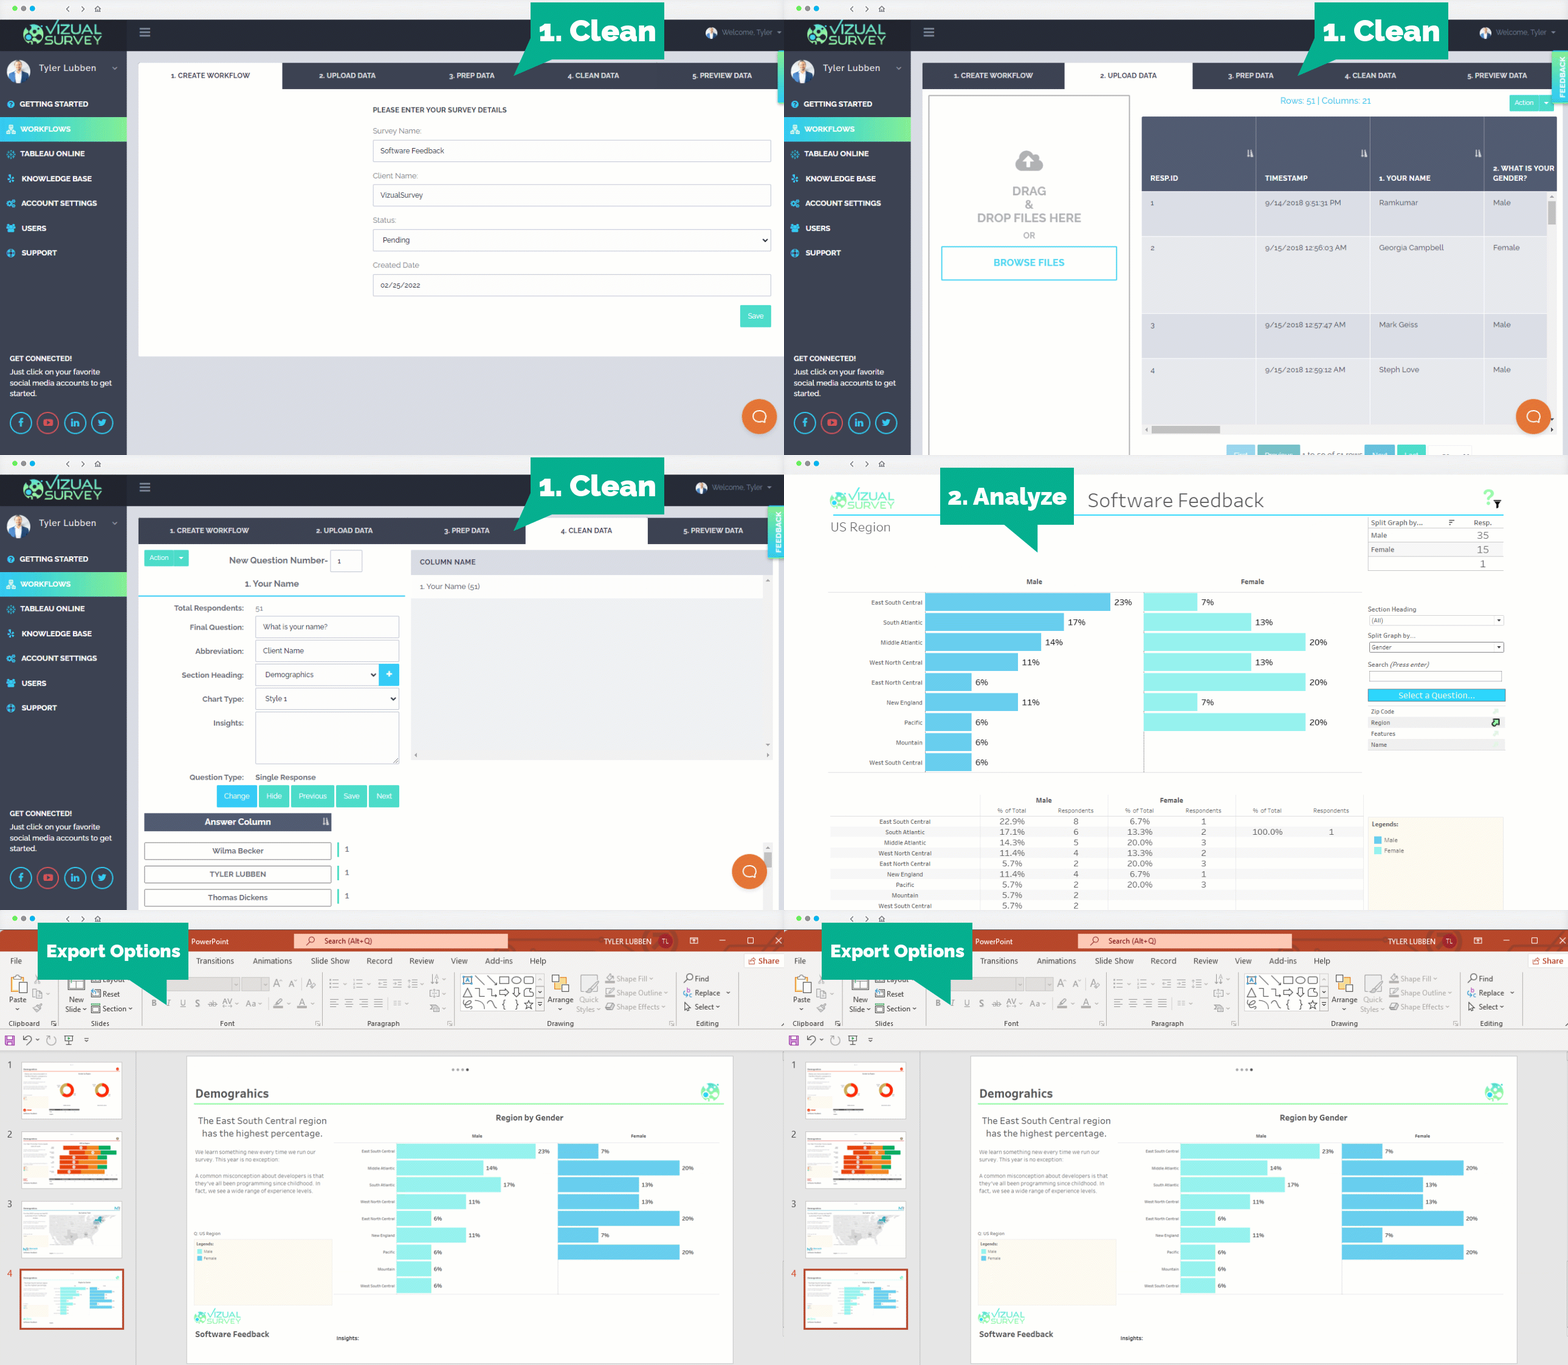
- No more screenshots into PowerPoint, create your report in Tableau and Export it into a PDF or PPT
More efficient, automated and streamlined DIY solution

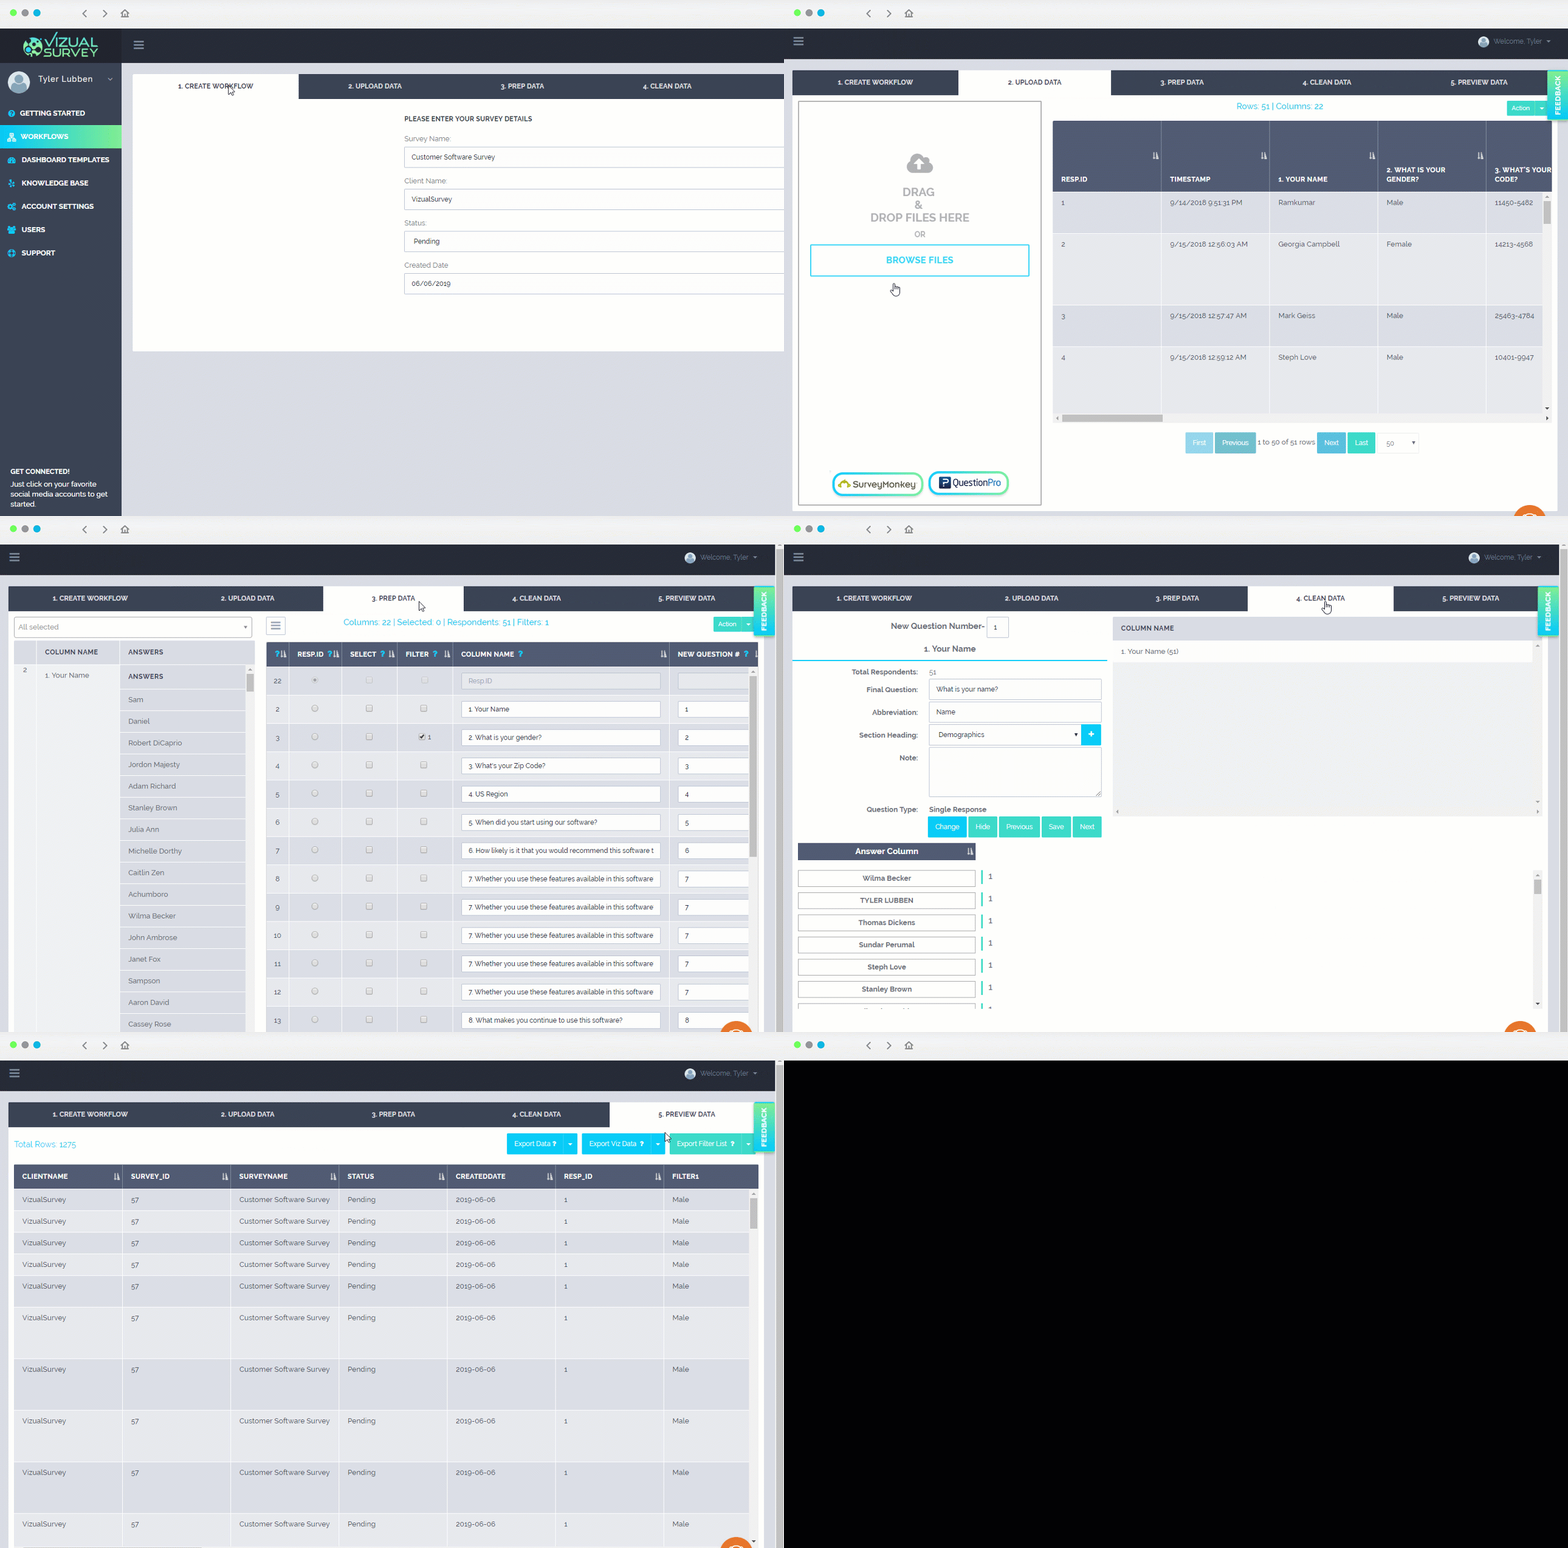
A simple 3 step process turns a month into a day
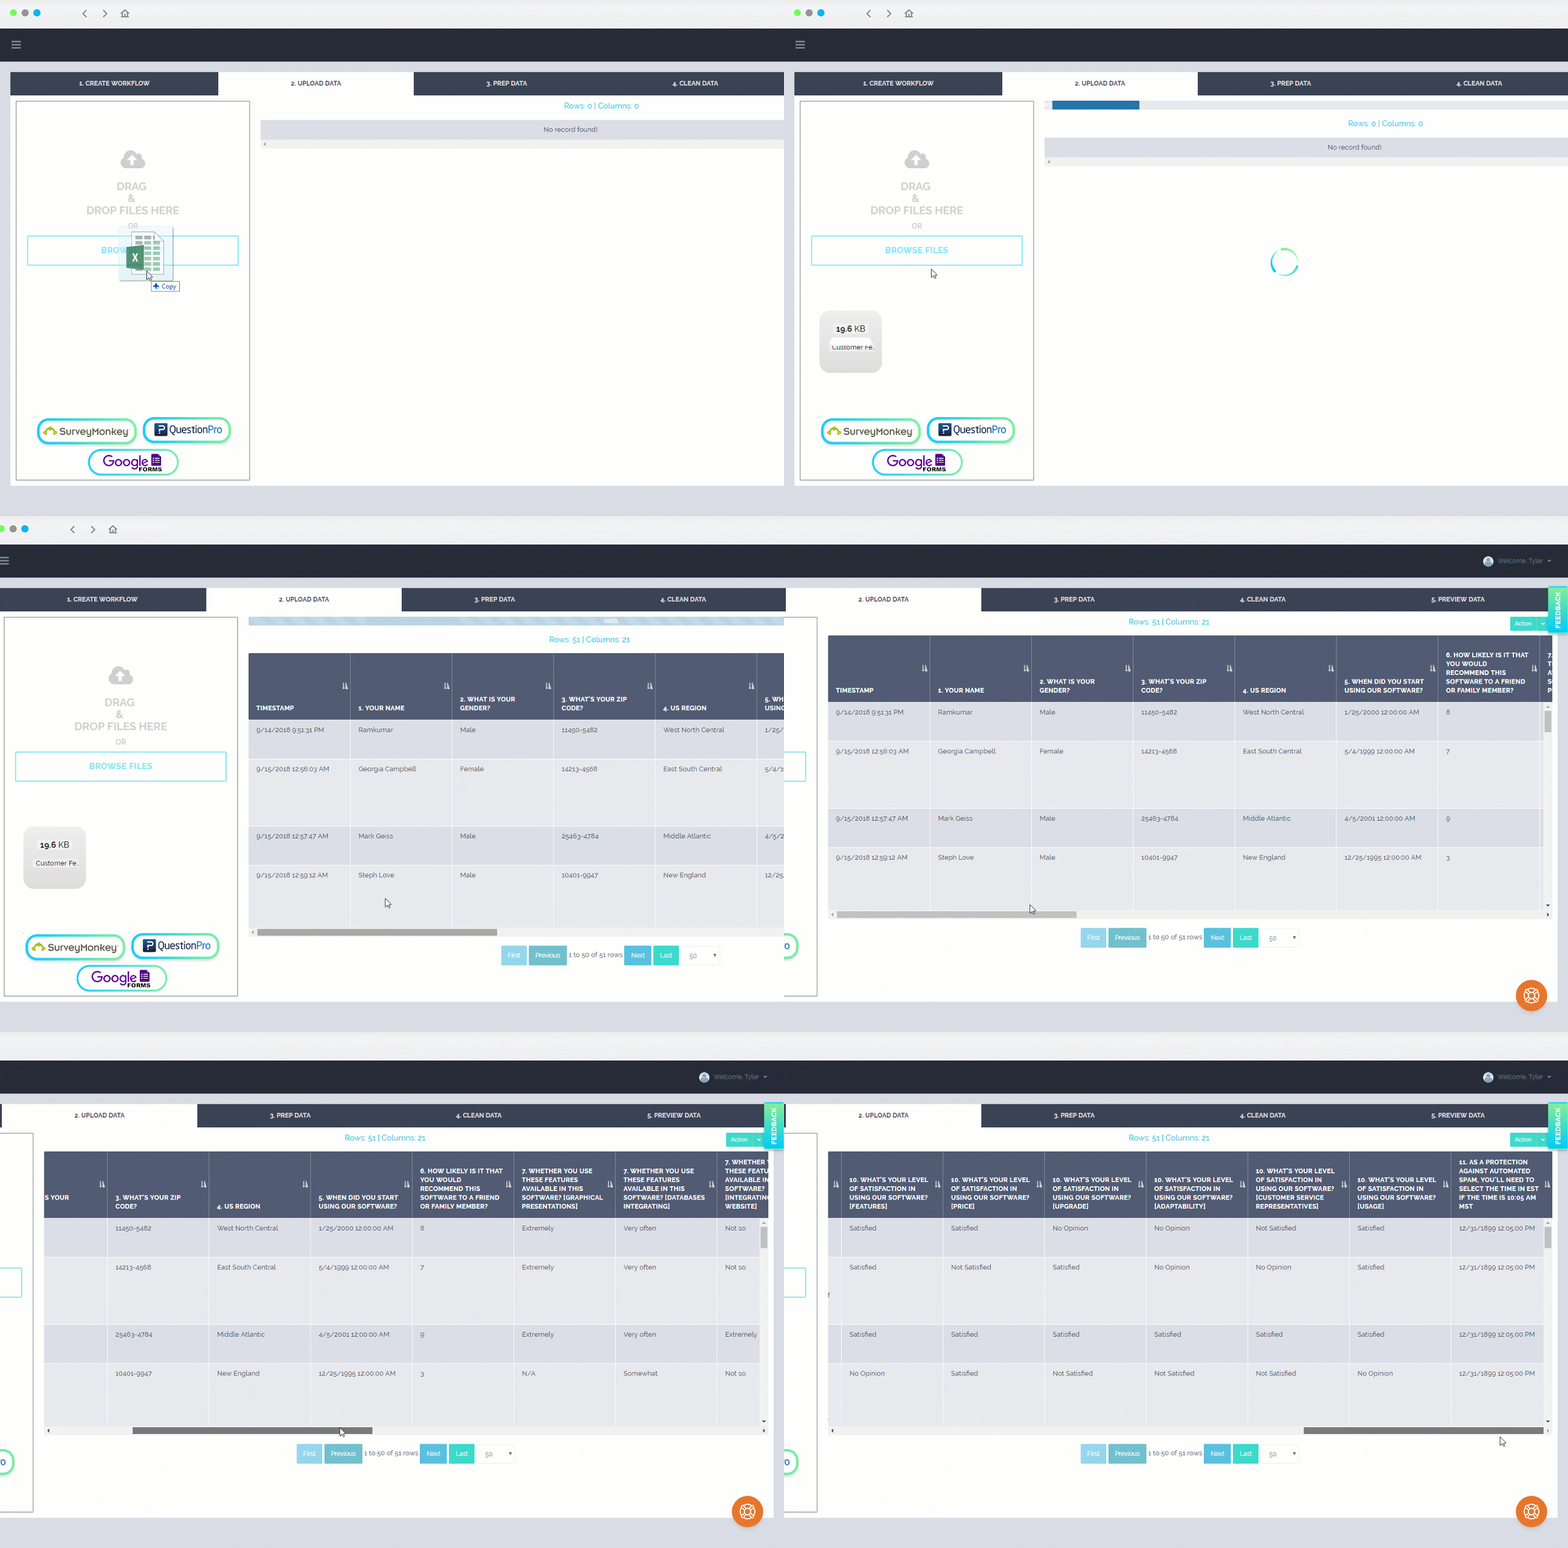
- Our industry leaders perfected the survey data cleaning and dashboard process and bundled it up into a self service tool for you to use
- We developed an easy-to-use survey data cleaning tool specifically to get you Tableau reports and dashboards without all the work
- New data, no problem… Update your reports in a few clicks without having to copy and paste
- No data cleaning or Tableau experience needed, follow our step by step process and spend your time on finding insights instead of trying to be a developer
More flexibility and customization

Unlimited possibilities and customization utilizing the full power of Tableau
- Add filters and segmentations into your slides for an interactive presentations that will wow your clients
- Integrate third-party data for a more holistic view
- Customize reports and dashboard templates without any limitation, if you can think it, it can be done
- Create personalize self service interactive reports and dashboards for clients to use
- Utilize all the features and benefits of the best data visualization tool on the market, Tableau
No more feeling out your depth and alone
VizualSurvey personalized approach ensures you use the software to its full power

- Gain access to our Tableau survey experts for those impossible projects and request
- Custom branded dashboards and report templates to fir your style and company design
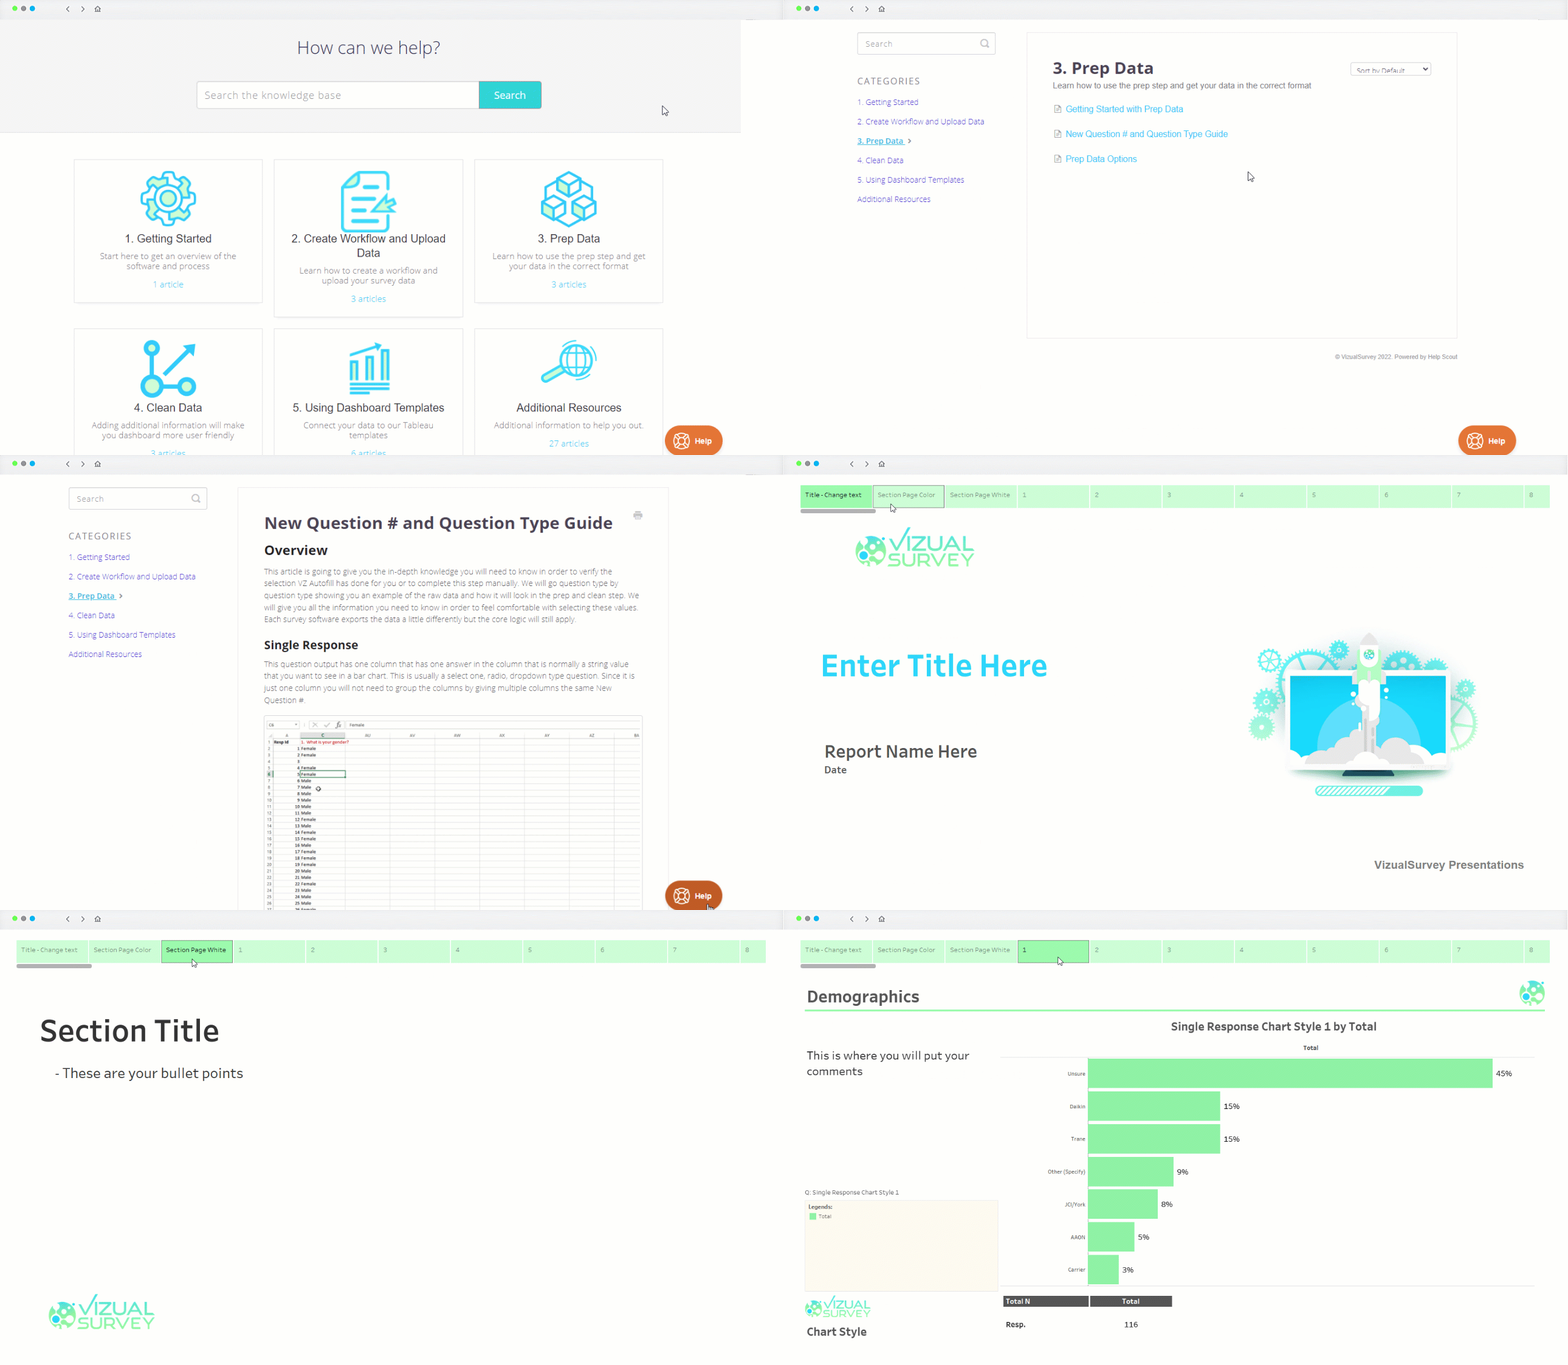
- Personalized onboarding, training and detailed knowledge base to make sure you are comfortable with the process
- Email support and constantly listening to feedback and releasing new features to make your life easier

Are you ready to start using
amazing survey dashboards?
See VizualSurvey in action with our free demo, stop using boring Excel charts and PPT’s, upgrade your analytics today!
